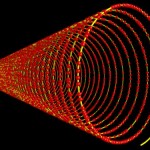
In this post I will present a very figurative way for visualizing genomes. We start with the data from the last post on “Genes and Genomes”, the gene order for chromosome 1 from the model plant Arabidopsis thaliana. Here these genes (about 8.000) are threaded like beads on a string.
- String of genes
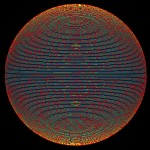
Now this string is wrapped around a sphere. The radius of this sphere is chosen in a way to have a correlation of base pair number and the surface of the sphere. The number of wrappings around the sphere is chosen in a way to avoid a clear visual impression of the wrapping (which would occur, if too few wrappings had been chosen). In addition, since somatic cells from Arabidopsis thaliana contain two copies of the genome, two identical strings have been wrapped in parallel around the sphere.
- Genes wrapped around a sphere
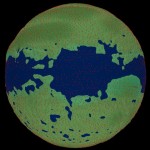
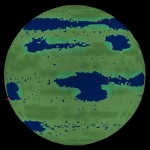
The density of genes on this sphere can be translated into the distribution of oceans, land and mountains on a planet. This has been done very approximately, in order to generate a continent/ocean-like distribution.
- Arabidopsis thaliana, chromosome I
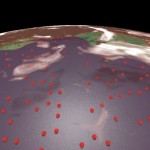
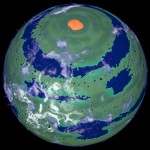
This would be a direct look onto the planet’s surface. Each gene is represented by a red dot. Clouds have been added randomly to generate a more realistic image.
- Arabidopsis thaliana, chromosome I
This last planet was constructed only from chromosome I, here comes a planet representing the whole genome. Centromers of the various chromosomes are represented by red cones. (There are always two of such cones closely together, since the two copies of the diploid genome have been wrapped in a more or less parallel way.) The centromers from chromosome 1, 3 and 4 are visible in this image. Missing centromers from chromosome 2 and 5 are located on the planet’s backside.
- Arabidopsis thaliana, complete genome
The organelle genome have been integrated at the poles. Here is the north pole with the mitochondrial genome, the chloroplast genome is located at the south pole. Clouds have been added randomly to generate a more realistic picture.
- Arabidopsis thaliana, complete genome
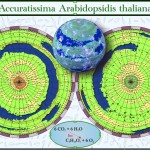
In order to stress the “discovery aspect”, I have produced historical maps from some of the planets. Here comes the one for Arabidopsis thaliana.
- Arabidopsis thaliana, complete genome
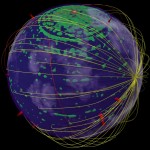
The approach can be used to visualize various topics in molecular genetics. Here comes, e.g., the human genome with the connections corresponding to two transcription factors (red and yellow).
- Complete human genome
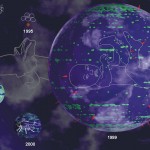
This last image shows a comparison of the genomes of a bacterium (Mycoplasma genitalium), an archaeon (Methanococcus janaschii), yeast (Saccharomyces cerevisiae), the model plant Arabidopsis thaliana, the fruit fly Drosophila melanogaster, man and the amphibium Necturus lewisi (in the background). The timing refers to the publication of these genomes.
- Genome comparison
Further reading:
Genome may be mostly junk after all
Now that’s a f***ing big genome!
German language:
1000 Genome sequenziert und immer noch nichts passiert

So Great! I need some infos in this post for my rapport de stage. Can i have your contact please? I need your permission to quote it . Anyway, That’s great job. Keep going.