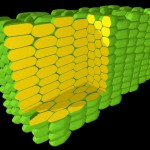
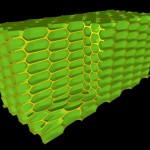
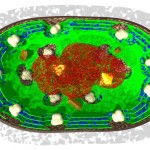
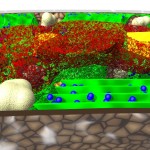
Life from Soil, Chapter 5

The chapter described in the following post is part of a very graphical powerpoint presentation on soil microbiology. This presentation is freely available at the Helmholtz-Centre for Environmental Research (UFZ) in Leipzig, Germany.

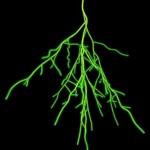
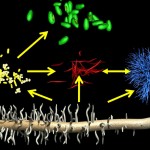
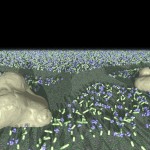
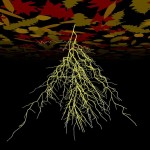
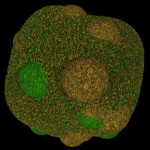
The title of chapter 5 is “Symbioses” which refers, to put it more precisely, only to mutualistic interactions between plants and microorganisms. There are a lot of such mutualistic interactions below ground. The reason for this is the fact that plant roots have a lot to offer to microorganisms. Plant roots are continuously excreting organic substances, which can be used as nutrients by microorganisms. This way they are like oases in the soil desert. The following image shows (in green color) the space influenced by the exudates from a small root system, the rhizosphere.

Rhizosphere

Rhizosphere

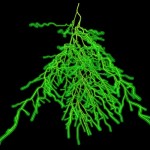
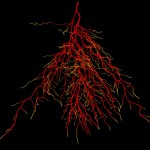
Microorganisms supporting plant growth increase the size and quality of this rhizosphere (their habitat).

Rhizosphere

More roots translate into a bigger rhizosphere

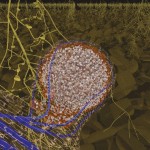
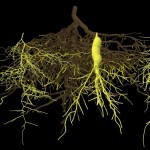
Many bacteria have chosen this approach. Some are producing growth factors, others are combating plant pathogens and others again are solubilizing or producing mineral nutrients. An example for this latter group is rhizobia, which are fixing atmospheric nitrogen. The process of nitrogen fixation is most efficient in the enclosed environment of the root nodules which contain transformed bacteroids devoted exclusively to satisfying the plant nitrogen demand.

Root nodule

Root nodule

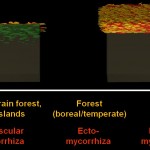
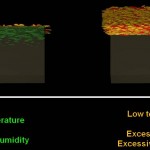
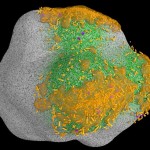
While bacteria can bridge only very short distances, fungi have the capacity to work over long distances, to explore the soil and to transport nutrients from various locations. Since they do this more efficient than roots (given their much finer hyphal system), mycorrhizas (symbioses between roots and fungi) have been very successful in evolution. These symbioses (arbuscular mycorrhiza, ectomycorrhiza, ericoid mycorrhiza) have already been covered in earlier postings. The following image shows the distribution of such symbioses, according to their ability to liberate nitrogen from organic remnants on a gradient of inhibition of plant litter degradation in various ecosystems.

Mycorrhizal ecology
Mycorrhizal ecology
Posted in Life below ground | Tagged , , , , , , , , , , , | Leave a comment

Life from Soil, Chapter 4

The chapter described in the following post is part of a very graphical powerpoint presentation on soil microbiology. This presentation is freely available at the Helmholtz-Centre for Environmental Research (UFZ) in Leipzig, Germany.

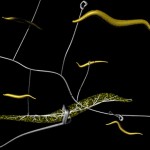
In a similar way as above-ground, life below-ground is a continuous interplay of organisms eating each other. The following graphic shows some major players (like bacteria, nematodes, fungi and ciliates) with roots at the basis of such food chains.

Soil food webs

Soil food webs

Let us start with roots, which can be attacked by organisms killing and digesting them (as here, e.g., a fungus)…

Pathogenic fungus

Pathogenic fungus

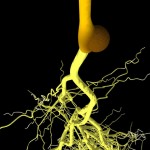
… or by parasitizing organisms, who often lead to abnormal growth (gall formation). Since root knot nematodes have been presented in another post, here comes a bacterial gall induced by Agrobacterium tumefaciens,

Bacterial gall

Bacterial gall

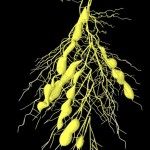
and galls induced by Plasmodiophora brassicae.

Clubroot disease

Clubroot disease

Such structures are places where parasitic organisms have succeeded in modifying plant development and metabolism, this way directing resources towards their own growth. The following image shows agrobacteria surrounding the modified cells from a bacterial gall.

Agrobacteria

Agrobacteria

Further examples for organisms eating each other are amebas eating bacteria,

Amebas

Amebas

ciliates eating bacteria,

Ciliates

Fungi eating other fungi,

Fungi

and fungi eating nematodes.

Fungi eating nematodes

Fungi eating nematodes

Posted in Life below ground | Tagged , , , , , , , | Leave a comment

Life from Soil, Chapter 3

The chapter described in the following post is part of a very graphical powerpoint presentation on soil microbiology. This presentation is freely available at the Helmholtz-Centre for Environmental Research (UFZ) in Leipzig, Germany.

Bacteria and fungi are the main organisms involved in the decomposition of plant material.

Bacteria and Fungi

Bacteria and Fungi

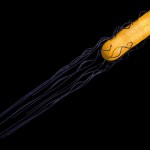
Bacteria have evolved a number of useful properties for doing this job in the soil. Some of them can swim,,,

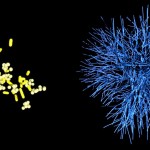
Swimming bacterium

Swimming bacterium

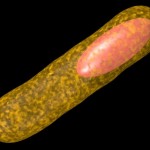
…others can form spores to survive unsuitable conditions…

Bacterial spore

Bacterial spore

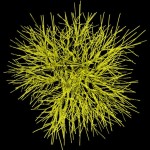
…while some have adopted a fungus-like life-style.

Fungal life-style

Fungal life-style

Bacteria can communicate using various signal molecules.

Bacterial communication

Bacterial communication

Bacteria can form protective biofilms.

Biofilms

Biofilms

Fungi, in contrast, have a completely different way of living and of colonizing a given substrate.

Saprophytic fungus

Saprophytic fungus

Posted in Life below ground | Tagged , , , | Leave a comment

Life from Soil, Chapter 2

The chapter described in the following post is part of a very graphical powerpoint presentation on soil microbiology. This presentation is freely available at the Helmholtz-Centre for Environmental Research (UFZ) in Leipzig, Germany.

Chapter 2 is about the provision of organic material (containing reduced carbon) to soil organisms. There are two ways, how plant derived carbon enters the soil: Either in the form of leaf litter (or other plant stuff falling down to the floor) or via the plant root.

Sources of plant carbon

Sources of plant carbon

Usually leaf litter is quickly degraded resulting in the liberation of various mineral nutrients incorporated in this litter and in the formation of certain remnants (humic acids) important for humus formation. Only when conditions are too humid, too arid, or too cold, leaf litter is hardly degraded. This leads then a) to the accumulation of leaf litter on soil surfaces (under dry conditions this may be the basis for regular wildfire, under humid conditions this may lead to bog formation) and b) to a serious scarcity of mineral nutrients which are captured within the undegraded material.

Litter degradation

Litter degradation

Roots are another important way for plant carbon into the soil, either in form of root exudates or of senescent parts of the roots. The following images will demonstrate that root systems can be very diverse. This diversity is responsible for at least a part of the diversity of soil microorganisms.

Root systems

Root systems

The image above gives root systems of different function and architecture. In the forground there are two main root systems (left and middle, dominated by the main root) and one lateral root system (right, dominated by lateral roots and typical, e.g., for grasses). In the background there is a tree root system, with completely different texture and color when compared to the herbal systems from the foreground, indicating differences in chemical composition.

There may be functional diversity, however, even within individual root systems, since nutrient uptake (including root exudates production) often is located close to the root tip (yellow color in the following image), while the more distal root sections are rather engaged in transport processes (red color).

Root functions

Root functions

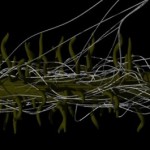
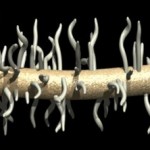
Due to the importance in nutrient uptake, the zone shortly behind the root tip is characterized by a strong production of root exudates and the presence of many root hair.

Root hair

Root hair

Posted in Life below ground | Tagged , , , | 1 Comment

Life from Soil, Chapter 1

The chapter described in the following post is part of a very graphical powerpoint presentation on soil microbiology. This presentation is freely available at the Helmholtz-Centre for Environmental Research (UFZ) in Leipzig, Germany.

Chapter 1 of the presentation soil microbiology covers the physicochemical basis – soil itself.
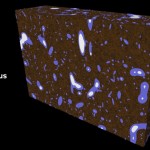
Soil chemistry is depending on the distribution of fluids and gases in soil,

Distribution of solid, liquid and gaseous phases in soil

Distribution of solid, liquid and gaseous phases in soil

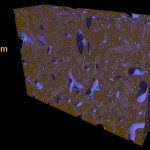
which, in turn depends on the distribution of soil pores.

Soil pores

Soil pores

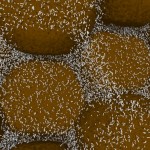
The distribution of soil pores, in turn, depends on the size distribution of soil particles and on aggregation of these particles. Here particle populations of identical volume, but with a tenfold difference in diameter are shown, to demonstrate the connection between particle size and pore size.

Particles and pores

Particles and pores

Soil particles are combined into soil aggregates and, ideally, those aggregates contain organic material (based on carbon and given in green color) and inorganic material (based mostly on silicon and given in brownish color).

Soil aggregate

Soil aggregate

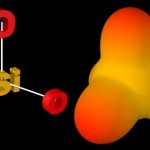
Silicic acid (one major component of inorganic soil material) is formed by the complete oxidation of silicon and is a very versatile building block of a large number of minerals.

Silicic acid

Silicic acid

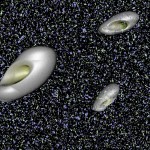
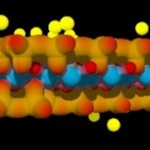
The most important ones of such minerals (in terms of being able to serve as nutrient reservoirs for plant life) are three-layered clay minerals. Individual layers consist of two silicate layers (brownish-red), one central layer of alumina (blue color) and positive ions (yellow color) attached to the outer surfaces of the silicate layers.

Three-layered clay mineral

Three-layered clay mineral

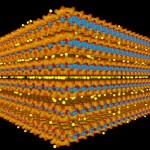
Such minerals may bind large numbers of ions like ammonia or potassium (given in yellow color), which are important for plant nutrition.

Three-layered clay mineral

Three-layered clay mineral

Further reading:

What Soil Aggregates Are and How its Stability Affects Soil Erosion

Erosion

Posted in Life below ground | Tagged , , , , , | 1 Comment

Presentation on soil microbiology
Cover of presentation

Cover of presentation

Since it is my scientific field (in a broader view) I have invested some effort and set up a very graphical presentation featuring soil and soil microbiology. The presentation is freely available at the Helmholtz-Centre for Environmental Research (UFZ) in Leipzig, Germany. Here comes a short summary of the various chapters. Each of them will be described in more details in subsequent posts.

Chapter 1 describes the physicochemical basis of living organisms below ground. It is primarily about soil structure, soil formation and clay minerals.

Cover of chapter 1

Cover of chapter 1

Chapter 2 describes the food basis for soil organisms. In a similar way as above ground, plants are providing most of the food below ground; they form the basis of most food chains in the soil. Soil organisms obtain plant nutrients either in the form of decomposing above ground material (leaf litter) or from plant roots.

Cover of chapter 2

Cover of chapter 2

Chapter 3 describes soil organisms living from the decomposition of dead organic material (either from plants or from other soil organisms).

Cover of chapter 3

Cover of chapter 3

Chapter 4 describes soil organisms living by preying on or parasitizing other soil organisms.

Cover of chapter 4

Cover of chapter 4

And chapter 5 describes soil organisms involved in mutualistic (mutually beneficial) interactions. This covers, amongst many other things, arbuscular mycorrhiza, one of my main research topics.

Cover of chapter 5

Cover of chapter 5

As already mentioned, the presentation is available for free and I don’t object against using it for educational purposes.

Posted in Life below ground | Tagged , , , , , , , | 2 Comments

Corrections of virtual genomic planets

Recently I became aware of a bug in the virtual genomic planets which I presented some posts ago. This post will be about my way of fixing this bug and I hope there will be some comments improving my approach even further. So this is rather a technical post…

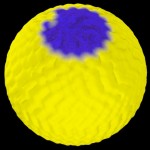
The genomic planets often contained mountain ranges in the polar regions and oceans at the equator. This was somewhat odd, but at least in some cases it correlated with the positions of centromers. In addition, I was sure that the distribution of genes on the sphere was correct, i.e., that the arc separating two genes really corresponded to the genomic distance of these genes. This is, however, not sufficient to ensure a realistic distribution of oceans and continents, as I had to realize. To examine this distribution, I constructed a planet from an artificial genome of equidistant genes, the size of the Yersinia pestis genome. In this planet regions with gene distances below a certain threshold are depicted as blue mountain ranges, the rest is colored in yellow. Since the artificial genome is composed of equidistant genes, the whole planet should show a uniform land type. This is, however, as shown in the image below, not the case.

Test planet for equidistant genome

Test planet for equidistant genome

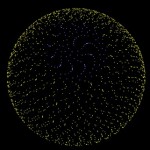
As observed in many “real” planets, even this homogenous planet contains mountain ranges in the polar regions. It took me a while to realize the reason. First I checked once again, whether the genes constituting the planet are really separated by identical arcs. They are as you can see below for the same planet , where gene positions are given as small blue or yellow dots (only the northern hemisphere is depicted here).

Gene distribution in equidistant planet

Gene distribution in equidistant planet

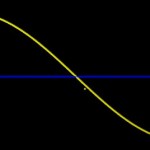
The planet surface is calculated from the actual distance of the points representing genes, not from the respective arc. This actual distance is always smaller than the arc with the error depending on the respective angle. With equidistant genes the angle decreases with latitude. In consequence, the large angles from the polar areas result in larger errors and smaller actual distances than the small angles around the equator. How to cope with this problem? I was not able to find a way to use distances instead of arcs for the planetary distribution of genes. The only way I could figure out was to distort gene distribution in a way reducing the densities of genes around the pole and increasing it at the equator. For this purpose I added the following function to the gene distribution. (Actually I applied three different functions covering three different regions of the genome, but I don’t want to go too much into details…)

Function for correcting the gene distribution

Function for correcting the gene distribution

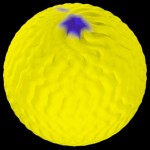
The function runs over the complete genome and every gene position is increased or decreased by its respective value. When this correction is applied the equidistant genome produces a more homogenous planet.

Corrected Planet

Corrected Planet

This is not the last word, however, since I became aware of another, better fix: I found a way of using the arc separating two genes rather than their distance for calculating surface features. The application of this approach to the artificial genome leads to uniform planets. Both area features occur in such planets only when the threshold between these features is set to a specific value. In this case yellow and blue areas are distributed randomly, which demonstrates that the new way of calculation is indeed unbiased.

Topological calculations from arcs instead of distances

Topological calculations from arcs instead of distances

Further reading:

Genome may be mostly junk after all

Now that’s a f***ing big genome!

Synthetic Genome Reboots Cell

The cancer genome

German language:

Eintausend Genome-Projekt

1000 Genome sequenziert und immer noch nichts passiert

1.000 Genome-Projekt veröffentlicht Gen-Karte

1000-Genome-Projekt legt menschliche Vielfalt offen

Posted in Genes and Genomes | Tagged , , | Leave a comment

Non-filamentous cyanobacteria I

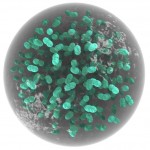
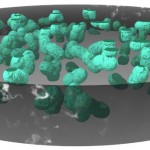
This post is about how to visualize non-filamentous cyanobacteria by taking the genus Aphanotheca as an example. Colonies of Aphanotheca show a rather simple morphology: a bunch of individual cells, clearly separated from each other is embedded in a globular gel-like matrix.

Aphanotheca

Aphanotheca

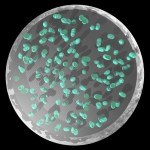
The next image simulates microscopy after ink-staining. (Incident light from below the object is absorbed by the ink but scattered by the gel-like matrix).

Aphanotheca

Aphanotheca

Now I add some light from above to improve the image of the individual cells.

Aphanotheca

Aphanotheca

Finally, it is possible, at least when using ray-tracing, to give the gel-like matrix a darker colour.

Aphanotheca

Aphanotheca

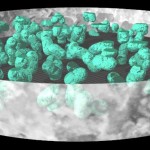
One of the great advantages of ray-tracing when compared to microscopy is the ease of preparing sections 😉 Here I am doing rather thick ones, but there is no problem doing ultrathin sections as well. (Well in this case there is no point as well…)

Aphanotheca

Aphanotheca

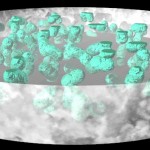
I am using several ways of illumination below.

Aphanotheca

Aphanotheca

Aphanotheca

Aphanotheca

And finally, how such a section would appear in bright field microscopy.

Aphanotheca

Aphanotheca

In the next post on cyanobacteria I will apply these ways of visualization to the various forms of non-filamentous cyanobacteria.

Further reading:

Cyanobacteria

Exploring cyanobacterial diversity in Antarctica blog

Did Cyanobacteria Produce Oxygen Oceanic Oases?

Cyanobacterial neurotoxin evolved billions of years ago

Microbes for biofuel: a cleaner way to unlock their energy

Posted in Algae | Tagged , , , | 2 Comments

Cellular structures

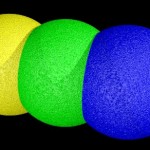
When it comes to modeling cellular structures, I have to start talking about some of the features of the program I am using to do so. I am using the ray-tracing program Pov-Ray, which only allows to use geometric structures (including some derivations and combinations) for modeling. So, it is not possible to just sculpt a certain shape as in many other programs. There is a workaround, as it is possible to generate bodies from the gradual addition/subtraction of spheres (and cylinders). I don’t want to go into the theory, therefore I use a simple example to show, how it works: Imagine three identical spheres of different color.

Blob formation

Blob formation

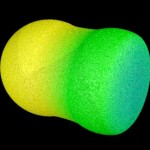
In this example the yellow and green sphere are fused together, while the blue sphere is subtracted. The object generated by this procedure is called a blob in Pov-Ray.

Blob formation

Blob formation

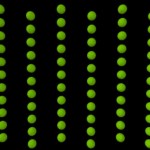
Now I will use such blobs to model cellular structures. I first restrict myself to two dimensions for better clarity. First we need the positions of the later cells. Since I want to model somewhat elongated cells, these positions are distributed unevenly.

Cellular positions

Cellular positions

Now the sphere are replaced by blobs generated from a central sphere from which spheres at the positions of the surrounding cells are subtracted. This nicely represents the counterplay of the osmotic pressure of a given cell and the pressure from its surrounding cells in many tissues. As you may see below, by using a similar principal as in nature, we will come to similar results. (That’s what making a model is all about…). Well, for the time being the results do not look that much convincing, but that is only because I chose parameters demonstrating the formation of the blobs. In addition, the blobs are sectioned to have a better view.

Modelling cells

Modelling cells

With the following parameters (increasing the pressure from the adjacent cells), the cells become more distinguishable.

Modelling cells

Modelling cells

Finally, I add some variation regarding the position of the individual cells …

Modelling cells

Modelling cells

… and increase the “pressure” in all structures.

So far everything was 2D; now let us switch to 3D (which is quite a demanding task at least for my computer…)

Simple cells

Simple cells

And here is the same structure with empty cells. My solution is not ideal, because, as soon as I try to make thinner cell walls, it becomes increasingly difficult to avoid holes within the walls.

Simple cells

Simple cells

Posted in Geometric structures | Tagged , , , | Leave a comment

Subcellular structures of free-living cyanobacteria

Cyanobacteria are the inventors of oxygen-producing photosynthesis and transformed the atmosphere of our planet this way. They shared their secrets then (in a very unusual way) with a large group of organisms, which nowadays form the basis of life at least on the surface of our planet. (Deep down below it is another story…).  a large and ancient group of photosynthetic bacteria with enormous importance in evolutionary history. They are responsible for oxygen formation on early earth and for the formation of higher photosynthetic organisms.

The pictures published here give you an insight into the internal structures of free-living cyanobacteria. They have been adapted from Image 2.1 from Christiaan van den Hoek, Hans Martin Jahns, David G. Mann (1993) Algen, 3. Edition, Georg Thieme Verlag Stuttgart, New York. The images show the nucleoid (red colour), carboxysomes (yellow colour), gas vesicles (dark yellow colour), the thylakoid membranes (green colour) with associated phycobiliproteids (blue colour), cyanophycin granules (similar to starch granules, white colour), the bacterial cell wall (brownish colour) and a slime capsule (grey colour). Bacterial ribosomes are given as very small black bodies. The scale in the first image is 200 nm long and has a diameter of 20 nm.

cytology of cyanobacteria
Cytology of cyanobacteria
cytology of cyanobacteria
Cytology of cyanobacteria

In the following two pictures only the photosynthetically active components have been marked in colour: thylakoid membranes in green and phycobiliproteids in blue colour.

Cytology of cyanobacteria

Cytology of cyanobacteria

Cytology of cyanobacteria

Cytology of cyanobacteria

Further reading:

Cyanobacteria

Exploring cyanobacterial diversity in Antarctica blog

Did Cyanobacteria Produce Oxygen Oceanic Oases?

Cyanobacterial neurotoxin evolved billions of years ago

Microbes for biofuel: a cleaner way to unlock their energy

Posted in Algae | Tagged , , , , , | Leave a comment