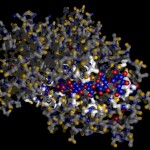
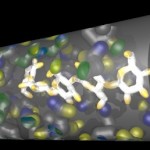
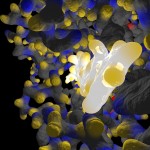
In the following postings I will explore some possibilities of the raytracing program Pov-ray to visualize protein structures. There are many other software solutions for such a purpose, of course… Raytracing, however, gives you a fair amount of flexibility. I won’t go too much into technical details here. (Basically the information necessary for Pov-Ray has to be extracted by some kind of additional program from the pdb-files storing the protein data. I am using PERL for this purpose, but there are certainly other solutions…) The protein I will use for visualizations is a fungal cellulase, described in 1997 by C.Divne, J.Stahlberg & T.A.Jones from Hypocrea jecorina. It has been cocrystallized with cellohexaose and cellobiose, which allows to take a closer look at the cellulose binding pocket of the enzyme.
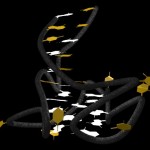
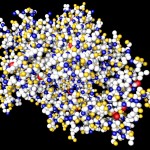
Here comes a first, rough picture with green representing C, blue representing N, red representing O and yellow representing S atoms in the protein structure. In the cocrystallized oligosaccharides white color represents C, yellow color O-atoms.
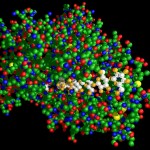
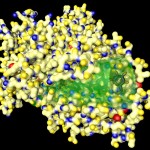
I thought, it might be a good idea to reflect about the way such structures are obtained. Actually proteins are not made of small balls of different colors, they rather consist exclusively of numbers. (Or what do you think is the result of the Fourier transformations the X-ray crystallographic data are subjected to?)
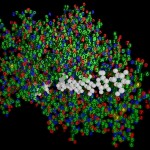
- The true nature of proteins
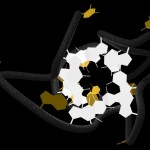
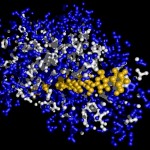
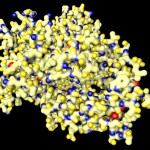
I was not very happy with the colors used in this image, therefore I played around a bit and ended like this:
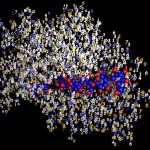
- The true nature of proteins
I will work with this combination of colors in most of the following postings on proteins.


